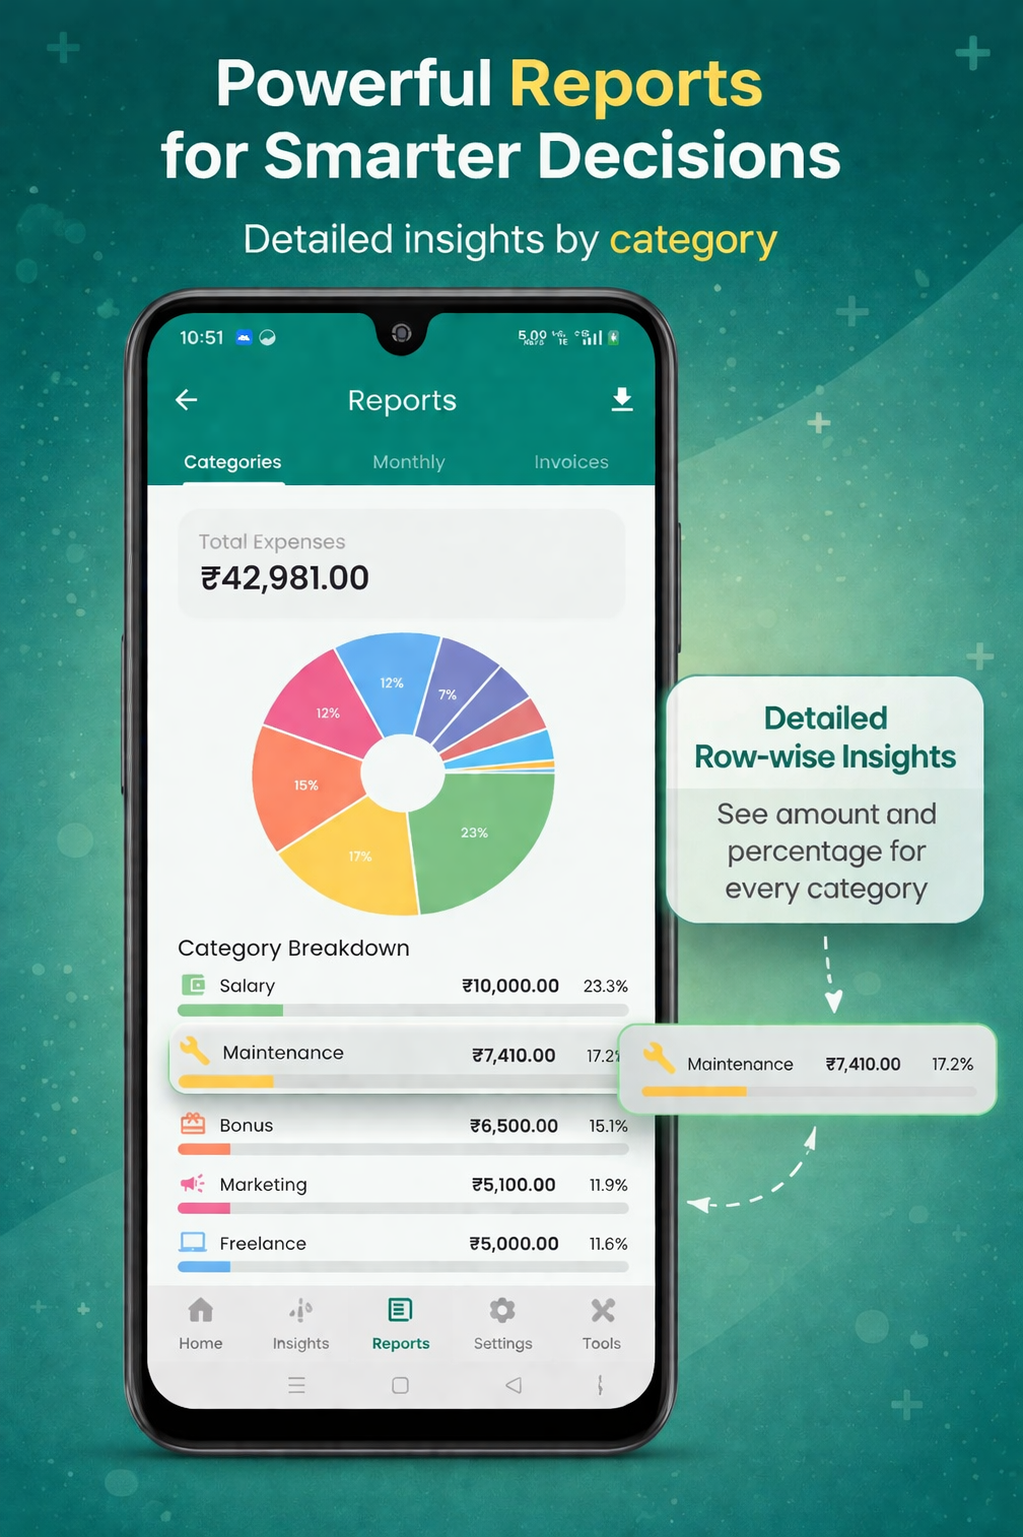
Category-wise breakdown with both ₹ and %.
Set a category budget
Open More → Budgets, tap + New budget, pick a category and amount. Each category has one monthly limit.
Track progress
The Budgets screen shows a horizontal progress bar per category:
- Green — under 70%
- Amber — between 70–95%
- Red — at or over 100%
Overspend warnings
When a category crosses 90%, a warning chip appears on the dashboard. Tap to see which category and how much remains.
Available reports
🥧
Category breakdown
Per-category total + % of total spend.
📅
Monthly trend
12-month income vs expense bars.
🧾
Invoice summary
Paid, partial & unpaid counts plus total receivables.
🏦
Account report
Inflows / outflows per Cash & Bank account.
👥
Party report
Outstanding by party, overdue chasers.
📦
Stock report
Movement, valuation, low-stock list.
🚶
Walk-in & Misc v3
Daily totals + full audit trail of every walk-in invoice and unassigned counter payment.
Export PDF / Excel / CSV
Every report has a share icon. Choose the format and pick:
- Date range & party / category filters
- PDF: includes your logo and header
- Excel: clean rows, ready for accountant import
- CSV: machine-readable for tools like Tally / Zoho
Monthly trend analysis
The trend report compares this month to last 11 months. Use it to:
- Spot seasonal spikes (e.g. festival months)
- Check if expenses grow faster than income
- Plan tax outflows ahead of quarter-end